Superharmonic response of a Duffing oscillator
MMS example on a Duffing oscillator subject to hard forcing triggering a superharmonic response. This configuration was studied by Nayfeh and Mook [2], sections 4.1.2 and 4.1.3.
System description
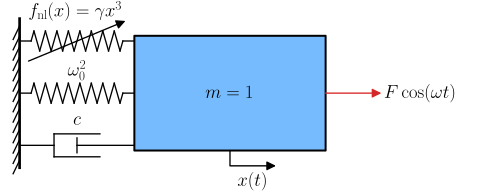
Illustration of a forced Duffing oscillator. Superharmonic oscillations (of order 3) are triggered provided \(F\) is large and \(\omega_0 \approx 3 \omega\).
The system’s equation is
where
\(x\) is the oscillator’s coordinate,
\(t\) is the time,
\(\dot{(\bullet)} = \mathrm{d}(\bullet)/\mathrm{d}t\) is a time derivative,
\(c\) is the linear viscous damping coefficient,
\(\omega_0\) is the oscillator’s natural frequency,
\(\gamma\) is the nonlinear coefficient,
\(F\) is the forcing amplitude,
\(\omega\) is the forcing frequency.
A parametric response around \(1/3\) times the oscillator’s frequency is sought so the frequency is set to
where
\(\epsilon\) is a small parameter involved in the MMS,
\(\sigma\) is the detuning.
The parameters are then scaled to indicate how weak they are:
\(c = \epsilon \tilde{c}\) indicates that damping is weak,
\(\gamma = \epsilon \tilde{\gamma}\) indicates that nonlinear damping is weak.
Note that the forcing is not scaled, i.e. \(F\) appears at leading order. This is called hard forcing.
Code description
The script below allows to
Construct the dynamical system.
Apply the MMS to the system,
Evaluate the MMS results at steady state,
Compute the forced response and the backbone curve,
 1# -*- coding: utf-8 -*-
 2
 3#%% Imports and initialisation
 4from sympy import symbols, Function, Rational
 5from sympy.physics.vector.printing import init_vprinting, vlatex
 6init_vprinting(use_latex=True, forecolor='White') # Initialise latex printing
 7from oscilate import MMS
 8
 9# Parameters and variables
10omega0, F, c = symbols(r'\omega_0, F, c', real=True,positive=True)
11gamma        = symbols(r'\gamma',real=True)
12t            = symbols('t')
13x            = Function(r'x', real=True)(t)
14
15# Dynamical system
16Eq  = x.diff(t,2) + omega0**2*x + gamma*x**3 + c*x.diff(t) # Equation (unforced)
17dyn = MMS.Dynamical_system(t, x, Eq, omega0, F=F)
18
19# Initialisation of the MMS sytem
20eps            = symbols(r"\epsilon", real=True, positive=True) # Small parameter epsilon
21Ne             = 1      # Order of the expansions
22omega_ref      = omega0 # Reference frequency
23ratio_omegaMMS = Rational(1,3) # Look for a superharmonic resonance of order 3
24
25param_to_scale = (gamma, F, c)
26scaling        = (1    , 0, 1)
27param_scaled, sub_scaling = MMS.scale_parameters(param_to_scale, scaling, eps)
28
29mms = MMS.Multiple_scales_oscillator(dyn, eps, Ne, omega_ref, sub_scaling, ratio_omegaMMS=ratio_omegaMMS)
30
31# Application of the MMS
32mms.apply_MMS(orders_polar="all")
33
34# Evaluation at steady state
35ss = MMS.Steady_state(mms)
36
37# Solve the evolution equations for a given dof
38solve_dof = 0 # dof to solve for
39ss.solve_bbc(solve_dof=solve_dof, c=param_scaled[-1])
40ss.solve_forced(solve_dof=solve_dof)
41
42# Plot the steady state results
43# -----------------------------
44import numpy as np
45
46# Set parameters' numerical values
47param_FRC = [(omega0, 1),
48             (c, 1e-2),
49             (gamma, 0.2),
50             (ss.coord.a[0], np.linspace(1e-10, 1.2, 1000)),
51             (dyn.forcing.F, 0.5)]
52
53# Frequency response
54BBC = MMS.visualisation.Backbone_curve(mms, ss, dyn, param_FRC)
55FRC = MMS.visualisation.Frequency_response_curve(mms, ss, dyn, param_FRC, bif=False)
56figs = FRC.plot(ss=ss, bbc=BBC)
57[fig.get_axes()[0].set_xlim(0.32, 0.38) for fig in figs ]
58
59# %%
Plot outputs
The plot outputs shown below are generated from the code above.
Frequency response curve
The two figures below display the amplitude and phase responses (blue) of the \(3^{\text{rd}}\) harmonic of the Duffing oscillator as a function of the excitation frequency. The backbone curve is shown in grey and the linear frequency divided by 3 in black.
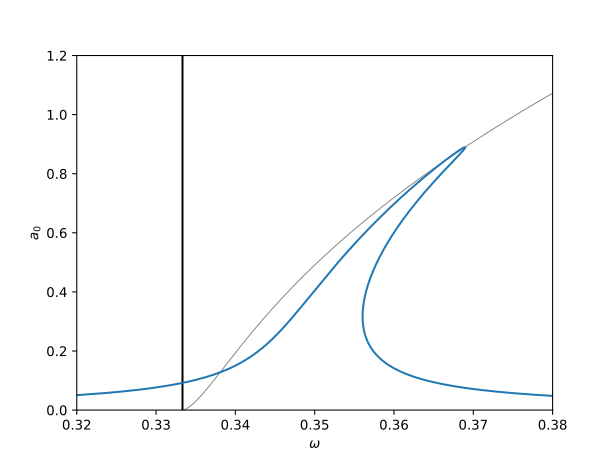
Frequency response curve of the Duffing oscillator in superharmonic regime of order 3 (amplitude).
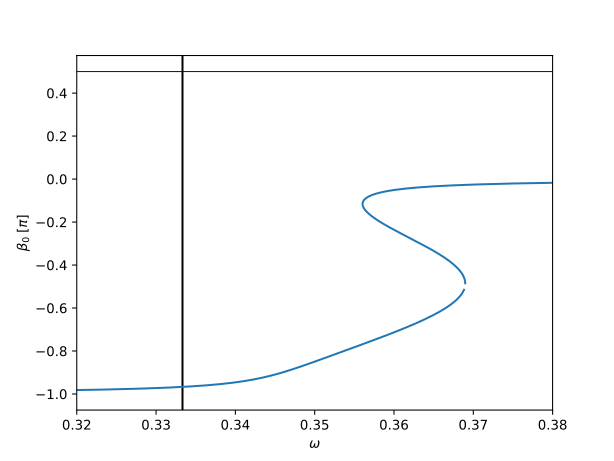
Frequency response curve of the Duffing oscillator in superharmonic regime of order 3 (phase).